
Broadcom quietly dropped a new fling at the end of July, and it lands right on the part of VCF 9.1 that changed the most. The management services layer. If you have spent any time upgrading Cloud Foundation, you already know the drill: something looks off, and you end up SSH-ing around the control plane at eleven at night, grepping logs across nodes and guessing which service actually broke. VCF Inspector is Broadcom’s answer to that.
Broadcom’s announcement has the full feature breakdown and UI screenshots: Introducing the VCF Inspector Fling.
It is a single binary. No appliance, no OVA, no agent to deploy. You download it, run it on your own workstation or a jumpbox, point it at a control plane node, and it reads back the health of the whole management stack. Zero footprint on the environment you are inspecting. For a homelab like mine, where every gigabyte of RAM on the nested hosts is already spoken for, that alone is worth a look.
What VCF Inspector actually is
It is a standalone diagnostic, health inspection, and troubleshooting tool built specifically for VCF 9.1 and VCF management services. It is free, and it lives on the Broadcom Support Portal under VMware Flings (version 1.200 at the time of writing). Alan Renouf’s team put it out, and it is aimed at the people doing the actual operational work: admins, support engineers, and architects who need a fast, structured picture of a 9.1 environment without hand-rolling SSH scripts.
The reason it exists is the management services model introduced in 9.1. That layer became the front door for centralised lifecycle and operational management across the whole fleet. It hosts lifecycle management, VCF SSO, Log Management, Salt configuration management, and more, all running as interconnected services spread across control plane and worker nodes. When one thing misbehaves, you are usually poking at several services at once to work out why. VCF Inspector pulls all of that into one view.
The three jobs it does
The fling covers three use cases, and they map neatly onto the moments where VCF work actually goes wrong.
1. Pre-upgrade readiness
This is the one I care about most for client work. Before you kick off a 9.1 upgrade, it runs automated pre-flight checks against SDDC Manager and vCenter so you are not relying on memory or a stack of KB articles. It validates:
- Password policy compliance and account expiration dates
- Host health and vSphere cluster readiness
- Required network port reachability, specifically SSH
22, HTTPS443, Platform API5480, and Cluster API6443 - Active lifecycle management task status and certificate expiration thresholds
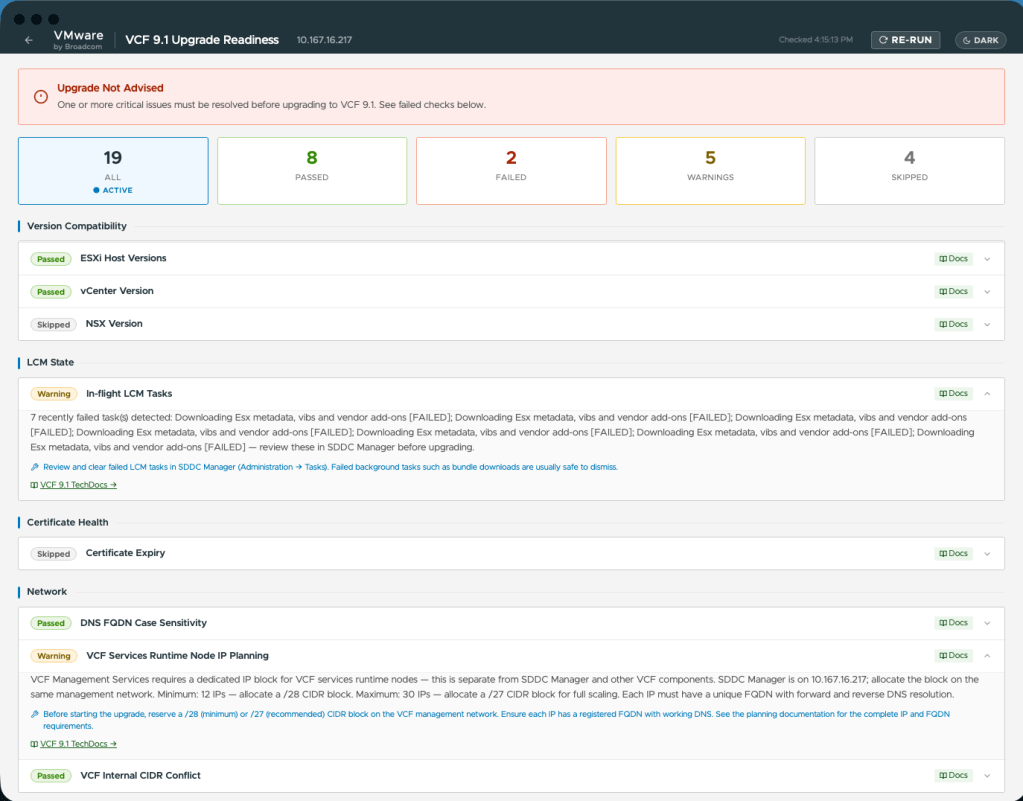
Where a check fails, it surfaces actionable remediation guidance instead of leaving you to interpret a red cross. Expired passwords and dead network ports are the two things that have quietly derailed more upgrade windows than I want to admit, so having them caught up front is genuinely useful.
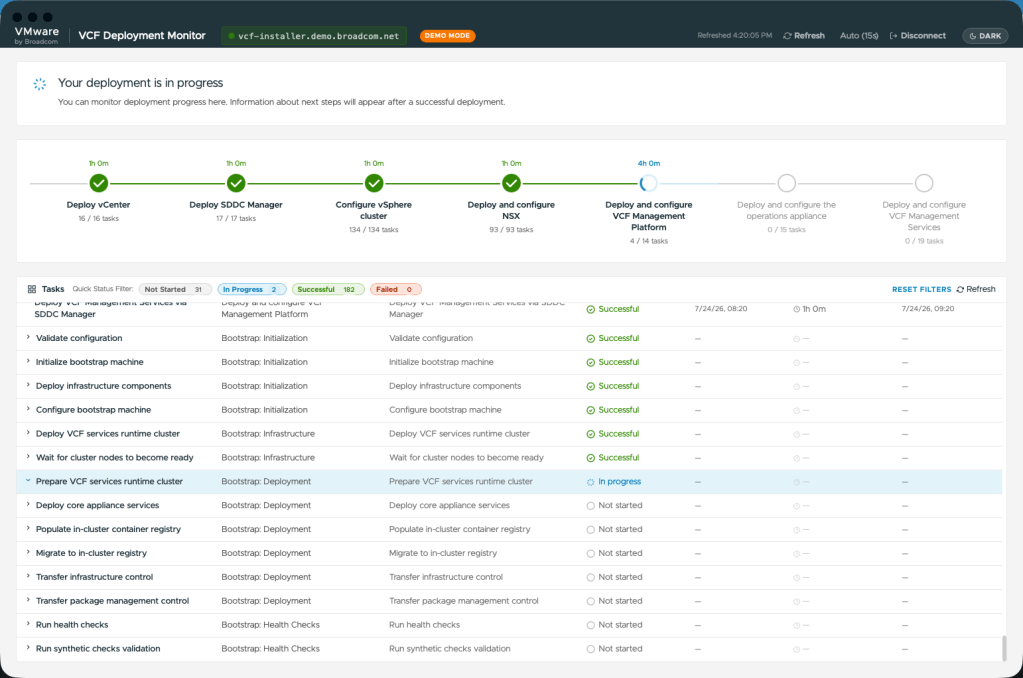
2. Live deployment and upgrade timeline
The second use case tracks an install or upgrade in real time. You get a timeline view of SDDC Manager subtasks and bootstrap stages, automatic stuck-task detection with root-cause extraction, and deep-links straight to the relevant Broadcom KB when it recognises a known issue. It also calculates stage durations and lets you filter stages, plus it has extra monitoring built in for the management services deployment tasks that are new to 9.1.
Anyone who has sat watching a bringup bar refuse to move, unsure whether it is working or wedged, will appreciate the stuck-task detection. That is the moment you normally start opening log files you would rather not.
3. Day-2 diagnostics
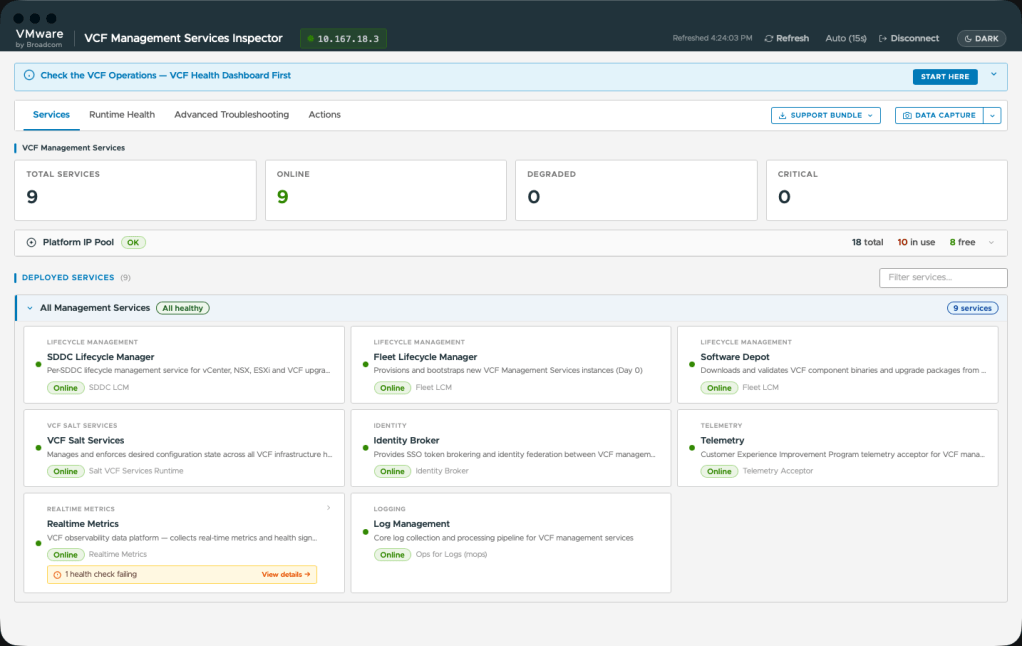
The third piece is the day-to-day health console, and it is the part with the most in it. With zero configuration it gives you:
- Instant service health across the management services (log management, fleet lifecycle, VCF Automation, identity broker, VMware Salt for VCF, telemetry) with health badges
- Platform IP and FQDN pool discovery, mapping control plane VIPs, worker node IPs, canonical FQDNs, and LoadBalancer services in one datagrid
- A node topology grid showing control plane and worker node placement and status
- A log analyzer that mines recent error and warning patterns, with component diagnostics and execution logs in a detail view
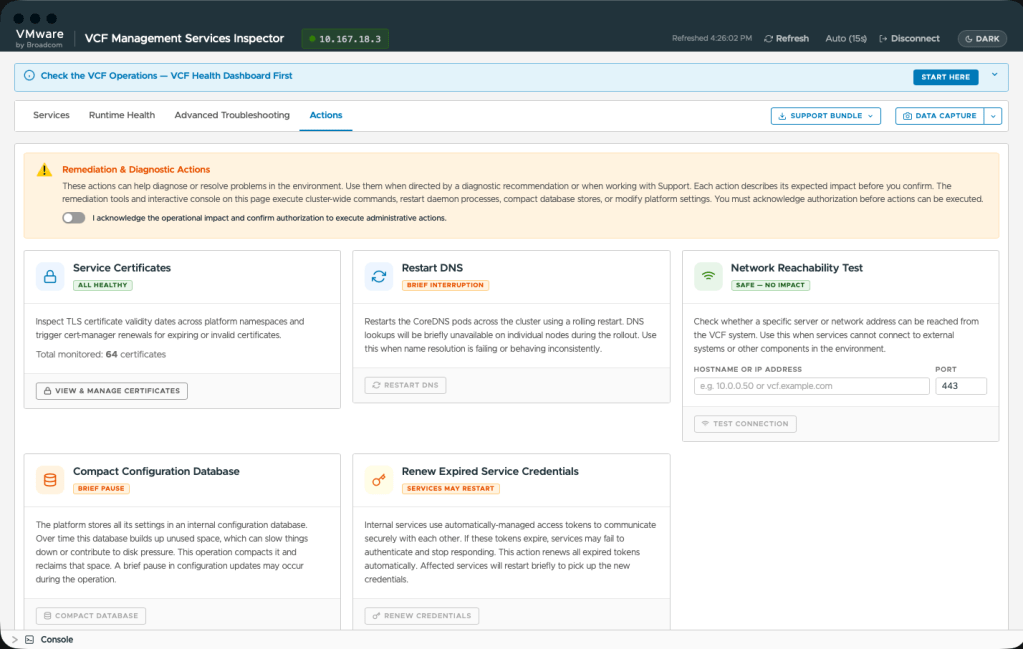
- One-click remediation actions: cert-manager certificate renewal, DNS rolling restart, system database compaction, and network reachability testing
- A safe terminal console that validates commands as read-only and blocks anything destructive
Two things stand out to me here. Those remediation actions are gated behind an interactive safety acknowledgment lock, which is the right call given a rolling DNS restart on the wrong environment would ruin your afternoon. And the terminal console being read-only by design means you can hand it to a junior engineer for status checks without lying awake worrying about what they might type.
Getting it running
Setup takes a couple of minutes. Grab the single binary for your OS from the Broadcom Support Portal under Free Downloads and VMware Flings. There is a build for each platform:
vcf-inspector-darwin-arm64-nativefor Apple siliconvcf-inspector-windows-amd64-native.exefor Windowsvcf-inspector-linux-amd64for Linux
On macOS or Linux you make it executable and run it, for example chmod +x ./vcf-inspector-linux-amd64 then ./vcf-inspector-linux-amd64. On Windows you just double-click the exe. Once it is up, you point it at the IP or FQDN of any VCF control plane node (or SDDC Manager), hand it the vmware-system-user credentials or your SDDC Manager admin login, and it establishes a secure session and populates the dashboards on its own.
Where it fits my workflow
For consulting, the pre-upgrade readiness check is the obvious win. Running it against a client environment the day before a change window, on my own laptop, without deploying anything into their estate, is exactly the kind of low-risk check I want before I commit to a maintenance slot. The remediation deep-links save the usual scramble through the KB.
At home, I run nested 9.1 management domains behind vc-mgmt.rmds.uk, and a lot of my time there goes on working out which service is sulking after a lab rebuild. A single tool that shows service health, node topology, and the FQDN pool in one pass is going to cut that down considerably. I will be keeping it on the jumpbox and putting it through a proper run against the nested lab over the next week.
It is a fling, so treat it as a fling. Community-supported, evolving, and worth feeding your bug reports and feature requests back through the VMware Flings community channels. But for a first release aimed at 9.1 management services, this is a tool I expect to reach for a lot.